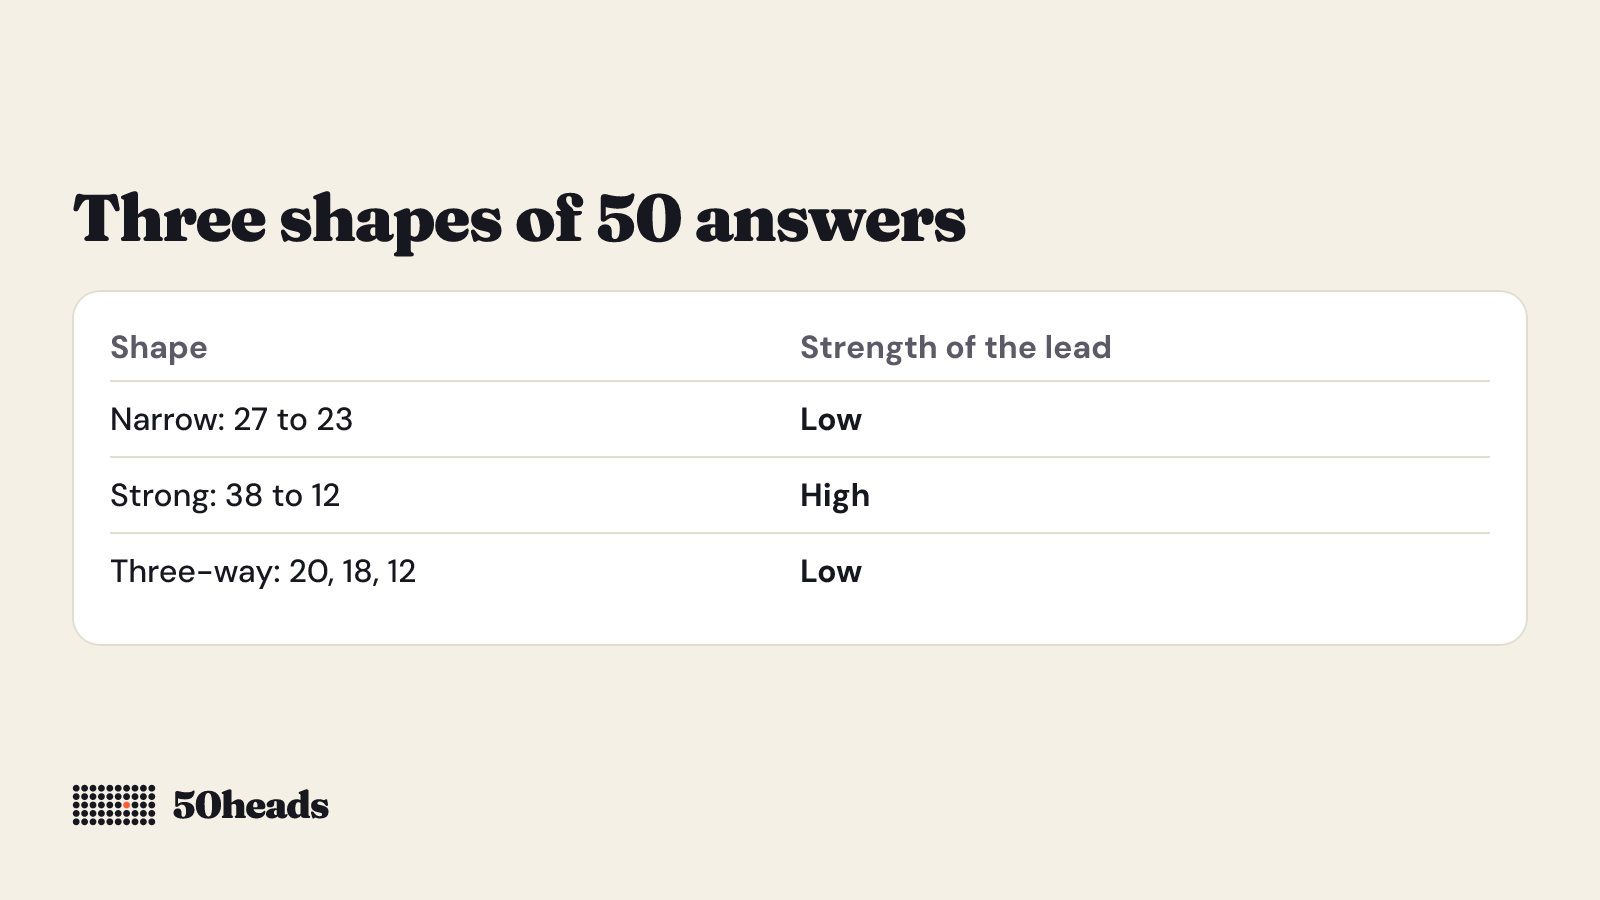
Fifty answers can show which of two to four options this group favoured, and whether the lead is large enough to act on. They cannot tell you what a whole market thinks, or why people chose as they did. Read the shape of the result, then the strength of the lead.
For how 20, 50 and 100 compare, see how many people you need for a preference test.
Three shapes of result
Most results from 50 answers look like one of these. The numbers below are made up to show the shape. They are not from real studies.
| Shape | Example answers | Lead | How strong for 50 answers |
|---|---|---|---|
| Narrow lead | A 27, B 23 | 4 answers, 8 points | Low |
| Strong lead | A 38, B 12 | 26 answers, 52 points | High |
| Three-way split | A 20, B 18, C 12 | 2 answers, 4 points | Low |
The strength labels follow the rule in what confidence means. We compare the gap between the top two options with how much that gap could vary by chance for this number of answers.
Narrow lead
A 27 to 23 result says A was ahead among these 50 answers. It says very little more. A gap this small can happen by chance with 50 people.
Treat the options as close. Choose on other grounds, such as cost or fit, or ask more people.
Strong lead
A 38 to 12 result is a large gap for 50 answers. Chance alone is an unlikely explanation. You can act on it, if the question was fair and the group was right.
A strong lead is still not proof that A is better. It shows what this group chose.
Three-way split
When answers spread across three options, no single option is clearly ahead. That is information too. It may mean the options are similar, or that people don't mind.
Consider dropping the weakest option and asking again. Fewer options spread the answers less thinly.
What 50 answers cannot tell you
- What a population thinks. A quick preference test shows what this group chose. It doesn't estimate the share of a country or market.
- Why. Ask 20 Tier 2 heads, people who have also passed an ID check, for a short written reason.
- Differences between small groups. Results can be broken down by country, tier, age band and gender, but only for groups of 5 or more answers. With 50 answers, slicing leaves groups too small to read.
- What people will do. Choosing when asked is not buying.
- Whether the question was fair. A leading question gives a strong lead for the wrong thing.
Rating questions work differently
A 1 to 5 scale question is read by its average, not by a lead. The result shows the average and how far it could be off, give or take. The more the answers cluster, and the more answers there are, the tighter that range and the stronger the confidence. With fewer than 10 answers it is always Low.
The average says how much people like one thing. It doesn't say which of two things they prefer. For a choice, ask a choice.
How to describe the result
| Say this | Not this |
|---|---|
| B led by 52 points among these 50 answers. | B is better. |
| The lead is strong for a sample this size. | The lead is real. |
| The options were close. | Nobody cares. |
If you publish a result, say it came from 50heads and how many heads answered. Our terms for requesters set this out.
What to do next
- Strong lead: act on it, and consider a follow-up asking why.
- Narrow lead: ask more people, or accept the tie.
- Split: drop the weakest option and ask again.
On 50heads you can add more heads to the same question and the result merges them. The estimate shows the cost and time first.
Next step
Start with a question and see the price. See pricing and try the estimator. It charges nothing. Fifty Tier 1 answers to a short question cost €12 and typically take about ten minutes.